|
|
REMOTE EXPLORATION METHOD (REM) SUMMARY
|
|
| ||||||
METHOD SUMMARY
Whether mineralization traps form or not (to put it more strictly - whether the concentration of the valuable component occurs or not) is the result of the spatial and temporal interplay between the uppermost crust permeability, fluid volume, and fluids and host rocks composition variations.
Although this statement is a bit of an oversimplification, it is evident that for a given geological area the greater probability of mineralization may be expected within the more permeable zones of the area. This is particularly true when dealing with structurally controlled mineralization.
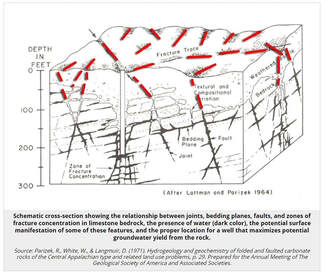
Therefore, the search for potentially high permeability zones should be an important part of greenfield and brownfield exploration. Permeability is a three-dimensional characteristic which is manifested (projected) on the surface (2D) mainly as linear feature assemblages – faults, fractures, fracture families, veins and vein stockworks, joints, geological contacts, water-channels, erosional landforms of various scales (figure below).
Whether mineralization traps form or not (to put it more strictly - whether the concentration of the valuable component occurs or not) is the result of the spatial and temporal interplay between the uppermost crust permeability, fluid volume, and fluids and host rocks composition variations.
Although this statement is a bit of an oversimplification, it is evident that for a given geological area the greater probability of mineralization may be expected within the more permeable zones of the area. This is particularly true when dealing with structurally controlled mineralization.
Therefore, the search for potentially high permeability zones should be an important part of greenfield and brownfield exploration. Permeability is a three-dimensional characteristic which is manifested (projected) on the surface (2D) mainly as linear feature assemblages – faults, fractures, fracture families, veins and vein stockworks, joints, geological contacts, water-channels, erosional landforms of various scales (figure below).
|
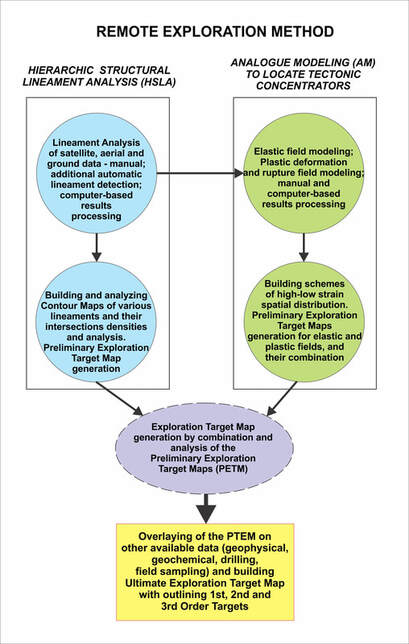
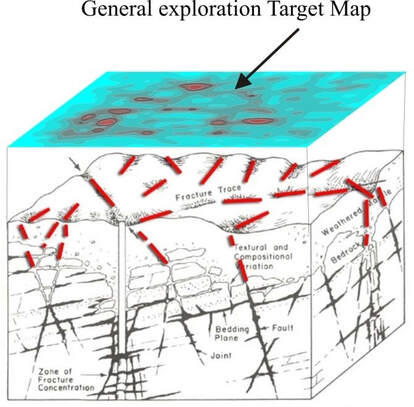
Consequently, evaluating and ranking spatial distribution of the densities of all natural linear features and their intersections (weighted according to their importance) would give us General Exploration Target Maps (figure below, left). The areas with the highest densities of these features would be the Targets for further exploration. Such study is conducted by Hierarchic Structural Lineament Analysis (HSLA) using aerial, satellite (radar, multispectral, hyper-spectral etc.) images, topography, DEM, geophysical, geochemical, geological maps/data etc.
HSLA: www.remoteexploration.com/hierarchic-structural-lineament-analysis-hsla.html All the analyzed features have been forming during long geological history. At each “moment” of their emerging they represented the potential pathways for the fluid flow. After their formation, they might have stayed active, or might have become inactive, sealed, or have been rejuvenated a number of times depending on their dimensions and their spatial positioning relative to the tectonic stress-field (figure below, right). |
|
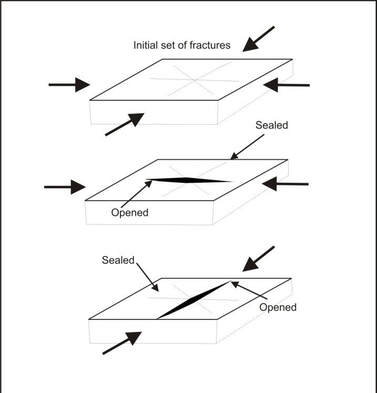
Fractures become opened (fluid pathways) or sealed (no fluid pathways) depending on their orientation to the main differential stress. |
|
Thus, the Maps generated by HSLA represent only a Cumulative Potential Permeability Field. We need to go further and try to understand the interaction of the main structures, to examine and learn if there exists any repetitive pattern of dilation zones/ shearing/fracturing – Attractors of Deformation (Tectonic Concentrators).
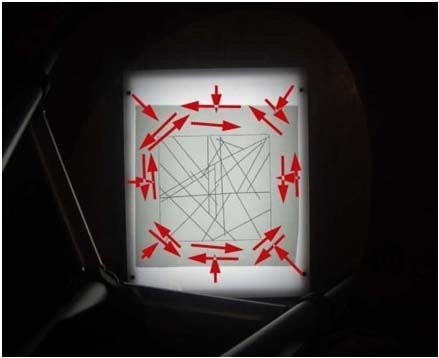
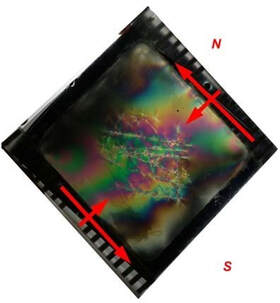
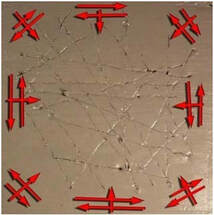
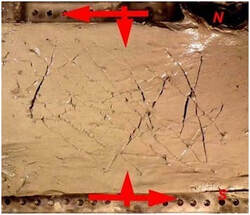
This examination is done by Analogue Physical Modeling (APM) www.remoteexploration.com/analogue-modeling.html https://www.linkedin.com/pulse/analogue-physical-modeling-efficient-low-cost-method-vadim-galkine/ The simulating (analogue) models of the geological block, with the cuts representing the main linear structures, are deformed repeatedly in different loading setups. Figures below represent principal settings and examples of elastic and plastic experiments: |
|
|
|
|
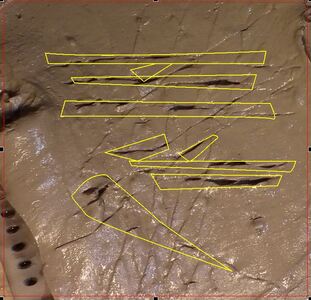
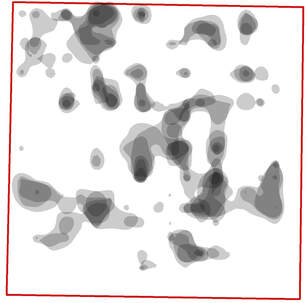
The photographs of the experiments (12 in elastic and 12 in plastic/rapture field separately) are analyzed. Dilation zones are outlined in each experiment (figure below, left). The stacking of the outlines of such zones onto each other gives us the opportunity to identify the areas with the highest proportion of the openings and fracturing (dilation) - figure below, right. We call these zones Attractors of Deformation (Tectonic Concentrators). They also represent the most permeable zones in the area under study. As a result, the Modeling–Based Exploration Target Maps (separately for elastic and plastic/rapture fields) are built.
|
|
|
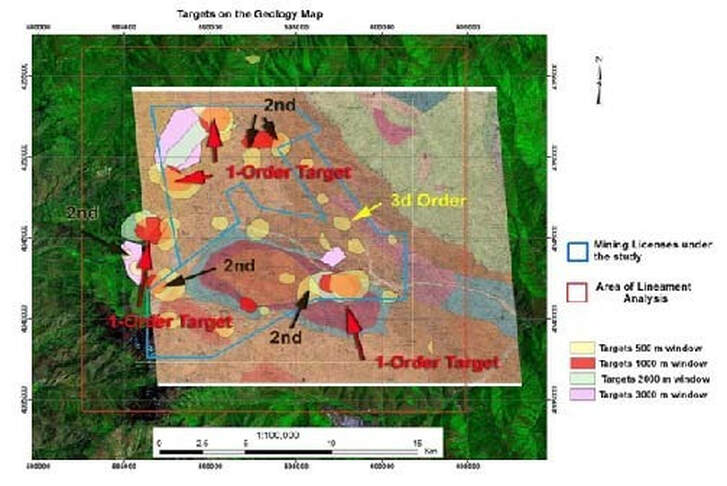
The final stage of the permeability field evaluation is to combine any available data (such as geological, geophysical, geochemical, prospecting and drilling) with our initial Target Maps to produce Principal Exploration Target Map. A resulting map (maps) outlines the priority areas where further exploration activities should be planned. |
|